FACSPy.pl.marker_density#
- FACSPy.pl.marker_density(adata, gate, layer, marker, groupby='sample_ID', colorby=None, highlight=None, ridge=False, alpha=0.1, add_cofactor=False, cmap='Set1', plot_height=1, plot_spacing=-0.5, plot_aspect=3, linewidth=0.5, linecolor=None, xlim=None, x_scale='linear', figsize=(3, 3), return_dataframe=False, return_fig=False, ax=None, show=True, save=None)#
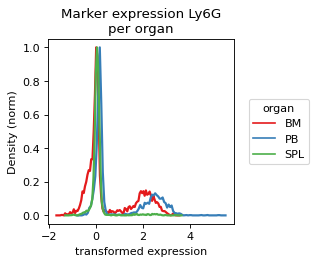
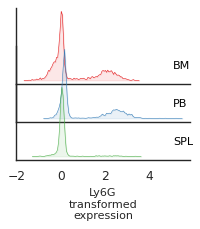
Histogram Plot of marker expression. Either as a Ridge-Plot or as a overlayed lineplot.
- Parameters:
adata (
AnnData) – The anndata object of shape n_obs x n_vars where rows correspond to cells and columns to the channels.gate (
str) – The gate to be analyzed, called by the population name. This parameter has a default stored in fp.settings, but can be superseded by the user.layer (
str) – The layer corresponding to the data matrix. Similar to the gate parameter, it has a default stored in fp.settings which can be overwritten by user input.marker (
str) – The channel to be displayed. Has to be in adata.var_names.groupby (
str) – Controls the x axis and the grouping of the data points.colorby (
Optional[str]) – Controls the coloring of the individual histogram lines.highlight (
Optional[Union`[:py:class:`list[str],str]]) – Controls whether to highlight a specific group of colorby. Highlighted groups will be red, other groups will be gray.ridge (
bool) – If True, a ridge-plot is shown. If False, an overlayed line plot is shown.alpha (
float) – Controls the opaqueness of area under the curve. Defaults to 0.1.add_cofactor (
bool) – If True, adds a line at the level of the cofactor.cmap (
Optional[str]) – Sets the colormap for plotting. Defaults to Set1plot_height (
float) – Height of the plot if ridge==True. For ridge==False use the figsize parameter to control the plot dimensions.plot_spacing (
float) – Spacing of the plots if ridge==True. Negative numbers will lead to overlapping of the histogram plots. Defaults to -0.5.plot_aspect (
float) – Controls the aspect of the plot if ridge==True.linewidth (
float) – Controls the linewidth of the histogram lines.linecolor (
Optional[str]) – Controls the coloring of the line if ridge==True. Defaults to None which results in a line coloring based on the groupby variable.xlim (
Optional[tuple[float,float]]) – Sets the limits of the x-axis.x_scale (
Literal['biex','log','linear']) – sets the scale for the x axis. Has to be one of biex, log, linear. The value biex gets converted to symlog internallyfigsize (
tuple[float,float]) – Contains the dimensions of the final figure as a tuple of two ints or floats. Only if ridge==False.return_dataframe (
bool) – If set to True, returns the raw data that are used for plotting as a dataframe.return_fig (
bool) – If set to True, the figure is returned.ax (
Optional[Axes]) – AAxescreated from matplotlib to plot into. Only works if ridge==False.show (
bool) – Whether to show the figure. Defaults to True.save (
Optional[str]) – Expects a file path including the file name. Saves the figure to the indicated path. Defaults to None.
- Return type:
Optional[Figure,Axes,DataFrame]]- Returns:
If show==False and ridge==False a
AxesIf show==False and ridge==True a
FigureIf return_fig==True a
FigureIf return_dataframe==True a
DataFramecontaining the data used for plotting
Examples
import FACSPy as fp

dataset = fp.mouse_lineages()

fp.pl.marker_density(
    dataset,
    gate = "CD45+",
    layer = "transformed",
    marker = "Ly6G",
    groupby = "organ",
    ridge = True,
    plot_aspect = 3
)
import FACSPy as fp

dataset = fp.mouse_lineages()

fp.pl.marker_density(
    dataset,
    gate = "CD45+",
    layer = "transformed",
    marker = "Ly6G",
    groupby = "organ",
    colorby = "organ",
    ridge = False,
    linewidth = 2
)