FACSPy.pl.cluster_heatmap#
- FACSPy.pl.cluster_heatmap(adata, gate, layer, cluster_key, include_technical_channels=False, exclude=None, data_metric='mfi', scaling='MinMaxScaler', corr_method='pearson', cluster_method='distance', annotate=None, annotation_kwargs=None, cmap='RdYlBu_r', y_label_fontsize=10, figsize=(5, 3.8), return_dataframe=False, return_fig=False, show=True, save=None)#
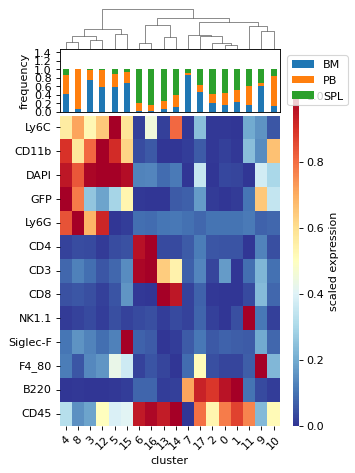
Plots a heatmap where every column corresponds to one cluster and the rows display the marker expression.
- Parameters:
adata (
AnnData) – The anndata object of shape n_obs x n_vars where Rows correspond to cells and columns to the channelsgate (
str) – The gate to be analyzed, called by the population name. This parameter has a default stored in fp.settings, but can be superseded by the user.layer (
str) – The layer corresponding to the data matrix. Similar to the gate parameter, it has a default stored in fp.settings which can be overwritten by user input.cluster_key (
str) – The .obs column where the cluster information is stored.include_technical_channels (
bool) – Whether to include technical channels. If set to False, will exclude all channels that are not labeled with type==”fluo” in adata.var.exclude (
Optional[Union`[:py:class:`list[str],str]]) – Channels to be excluded from plotting.data_metric (
Literal['mfi','fop']) – One of mfi or fop. Using a different metric will calculate the asinh fold change on mfi and fop values, respectivelyscaling (
Optional[Literal['MinMaxScaler','RobustScaler','StandardScaler']]) – Whether to apply scaling to the data for display. One of MinMaxScaler, RobustScaler or StandardScaler (Z-score).corr_method (
Literal['pearson','spearman','kendall']) – correlation method that is used for hierarchical clustering by cluster correlation. if cluster_method==distance, this parameter is ignored. One of pearson, spearman or kendall.cluster_method (
Literal['correlation','distance']) – Method for hierarchical clustering of displayed clusters. If correlation, the correlation specified by corr_method is computed (default: pearson). If distance, the euclidean distance is computed.annotate (
Optional[Literal['frequency'],str]]) – Parameter to control the annotation plot. Default: frequency. Adds a plot on top of the heatmap to display cluster-specific data. Other valid values are marker names as contained in adata.var_namesannotation_kwargs (
Optional[dict]) – Used to specify and customize the annotation plot.cmap (
Optional[str]) – Sets the colormap for plotting the markersy_label_fontsize (
Optional[Union`[:py:class:`float,int]]) – controls the fontsize of the marker labelsfigsize (
Optional[tuple[float,float]]) – Contains the dimensions of the final figure as a tuple of two ints or floats.return_dataframe (
bool) – If set to True, returns the raw data that are used for plotting as a dataframe.return_fig (
bool) – If set to True, the figure is returned.show (
bool) – Whether to show the figure. Defaults to True.save (
Optional[str]) – Expects a file path including the file name. Saves the figure to the indicated path. Defaults to None.
- Return type:
Optional[ClusterGrid,DataFrame]]- Returns:
If show==False a
ClusterGridIf return_fig==True a
ClusterGridIf return_dataframe==True a
DataFramecontaining the data used for plotting
Examples
import FACSPy as fp

dataset = fp.mouse_lineages()

fp.settings.default_gate = "CD45+"
fp.settings.default_layer = "transformed"

fp.tl.pca(dataset)
fp.tl.neighbors(dataset)
fp.tl.leiden(dataset)

fp.tl.mfi(dataset,
          groupby = "CD45+_transformed_leiden",
          aggregate = True)

fp.pl.cluster_heatmap(
    dataset,
    gate = "CD45+",
    layer = "transformed",
    cluster_key = "CD45+_transformed_leiden",
    annotate = "frequency",
    annotation_kwargs = {"groupby": "organ"},
    figsize = (4,6)
)