FACSPy.pl.cell_counts#
- FACSPy.pl.cell_counts(adata, gate, groupby, splitby=None, cmap=None, order=None, stat_test='Kruskal', figsize=(3, 3), return_dataframe=False, return_fig=False, ax=None, show=True, save=None, **kwargs)#
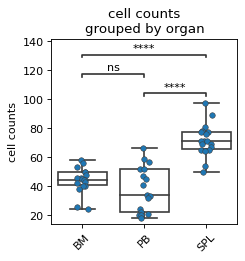
Plots the cell counts of a specific population.
- Parameters:
adata (
AnnData) – The anndata object of shape n_obs x n_vars where rows correspond to cells and columns to the channelsgate (
str) – The gate to be analyzed, called by the population name. This parameter has a default stored in fp.settings, but can be superseded by the user.groupby (
str) – controls the x axis and the grouping of the data pointssplitby (
Optional[str]) – The parameter controlling additional split along the groupby-axis.cmap (
Optional[str]) – Sets the colormap for plotting. Can be continuous or categorical, depending on the input data. When set, both seaborns ‘palette’ and ‘cmap’ parameters will use this valueorder (
Optional[Union`[:py:class:`list[str],str]]) – specifies the order of x-values.stat_test (
Optional[str]) – Statistical test that is used for the p-value calculation. One of Kruskal and Wilcoxon. Defaults to Kruskal.figsize (
tuple[float,float]) – Contains the dimensions of the final figure as a tuple of two ints or floats.return_dataframe (
bool) – If set to True, returns the raw data that are used for plotting as a dataframe.return_fig (
bool) – If set to True, the figure is returned.ax (
Optional[Axes]) – AAxescreated from matplotlib to plot into.show (
bool) – Whether to show the figure. Defaults to True.save (
Optional[str]) – Expects a file path including the file name. Saves the figure to the indicated path. Defaults to None.kwargs – keyword arguments ultimately passed to sns.stripplot.
- Return type:
Optional[Figure,Axes,DataFrame]]- Returns:
If show==False a
AxesIf return_fig==True a
FigureIf return_dataframe==True a
DataFramecontaining the data used for plotting
Examples
import FACSPy as fp

dataset = fp.mouse_lineages()

fp.pl.cell_counts(
    dataset,
    gate = "B_cells",
    groupby = "organ"
)