FACSPy.pl.expression_heatmap#
- FACSPy.pl.expression_heatmap(adata, gate, layer, metadata_annotation=None, marker_annotation=None, include_technical_channels=False, exclude=None, data_group='sample_ID', data_metric='mfi', scaling='MinMaxScaler', corr_method='pearson', cluster_method='distance', cmap='RdBu_r', metaclusters=None, label_metaclusters_in_dataset=True, label_metaclusters_key='metacluster_sc', y_label_fontsize=10, figsize=(5, 3.8), return_dataframe=False, return_fig=False, show=True, save=None)#
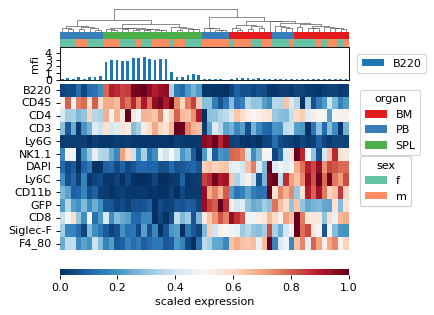
Plot for expression heatmap. Rows are the individual channels and columns are the data points.
- Parameters:
adata (
AnnData) – The anndata object of shape n_obs x n_vars where rows correspond to cells and columns to the channelsgate (
str) – The gate to be analyzed, called by the population name. This parameter has a default stored in fp.settings, but can be superseded by the user.layer (
str) – The layer corresponding to the data matrix. Similar to the gate parameter, it has a default stored in fp.settings which can be overwritten by user input.metadata_annotation (
Optional[Union`[:py:class:`list[str],str]]) – Controls the annotated variables on top of the plot.marker_annotation (
Optional[str]) – creates a second plot on top of the heatmap where marker expressions can be shown.include_technical_channels (
bool) – Whether to include technical channels. If set to False, will exclude all channels that are not labeled with type==”fluo” in adata.var.exclude (
Optional[Union`[:py:class:`list[str],str]]) – Channels to be excluded from plotting.data_group (
str) – When MFIs/FOPs are calculated, and the groupby parameter is used, use data_group to specify the right dataframedata_metric (
Literal['mfi','fop']) – One of mfi or fop. Using a different metric will calculate the asinh fold change on mfi and fop values, respectivelyscaling (
Optional[Literal['MinMaxScaler','RobustScaler','StandardScaler']]) – Whether to apply scaling to the data for display. One of MinMaxScaler, RobustScaler or StandardScaler (Z-score).corr_method (
Literal['pearson','spearman','kendall']) – Correlation method that is used for hierarchical clustering by sample correlation. if cluster_method == distance, this parameter is ignored. One of pearson, spearman or kendall.cluster_method (
Literal['correlation','distance']) – Method for hierarchical clustering of displayed samples. If correlation, the correlation specified by corr_method is computed (default: pearson). If distance, the euclidean distance is computed.cmap (
str) – Sets the colormap for plotting the markersmetaclusters (
Optional[int]) – controls the n of metaclusters to be computedlabel_metaclusters_in_dataset (
bool) – Whether to label the calculated metaclusters and write into the metadatalabel_metaclusters_key (
Optional[str]) – Column name that is used to store the metaclusters iny_label_fontsize (
Optional[Union`[:py:class:`float,int]]) – controls the fontsize of the marker labelsfigsize (
Optional[tuple[float,float]]) – Contains the dimensions of the final figure as a tuple of two ints or floats.return_dataframe (
bool) – If set to True, returns the raw data that are used for plotting as a dataframe.return_fig (
bool) – If set to True, the figure is returned.show (
bool) – Whether to show the figure. Defaults to True.save (
Optional[str]) – Expects a file path including the file name. Saves the figure to the indicated path. Defaults to None.
- Return type:
Optional[ClusterGrid,DataFrame]]- Returns:
If show==False a
ClusterGridIf return_fig==True a
ClusterGridIf return_dataframe==True a
DataFramecontaining the data used for plotting
Examples
import FACSPy as fp

dataset = fp.mouse_lineages()

fp.tl.mfi(dataset, layer = "transformed")

fp.pl.expression_heatmap(
    dataset,
    gate = "CD45+",
    layer = "transformed",
    metadata_annotation = ["organ", "sex"],
    marker_annotation = "B220"
)