FACSPy.pl.fold_change#
- FACSPy.pl.fold_change(adata, gate, layer, groupby, group1, group2, data_group='sample_ID', data_metric='mfi', include_technical_channels=False, exclude=None, stat='p', cmap='Reds_r', test='Kruskal', min_pval=None, comparison_label=None, group1_label=None, group2_label=None, figsize=(4, 10), return_dataframe=False, return_fig=False, ax=None, show=True, save=None)#
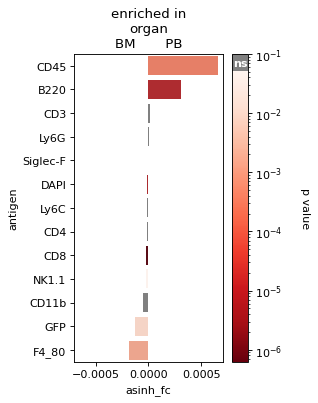
Plots the asinh fold change.
The asinh fold change is calculated from the MFI values of the compensated data. It is similar to the log2fc, but since log does not allow negative values, we calculate the asinh foldchange as asinh(mean(group2)) - asinh(mean(group1)). The p_value is calculated using the specified test and the asinh transformed expression values per sample.
- Parameters:
adata (
AnnData) – The anndata object of shape n_obs x n_vars where Rows correspond to cells and columns to the channelsgate (
str) – The gate to be analyzed, called by the population name. This parameter has a default stored in fp.settings, but can be superseded by the user.layer (
str) – The layer corresponding to the data matrix. Similar to the gate parameter, it has a default stored in fp.settings which can be overwritten by user input.groupby (
str) – The variable of both groups that are comparedgroup1 (
Union[list[Union[str,int]],str]) – The first group to be comparedgroup2 (
Union[list[Union[str,int]],str]) – The second group to be compareddata_group (
str) – When MFIs/FOPs are calculated, and the groupby parameter is used, use data_group to specify the right dataframedata_metric (
Literal['mfi','fop']) – One of mfi or fop. Using a different metric will calculate the asinh fold change on mfi and fop values, respectivelyinclude_technical_channels (
bool) – Whether to include technical channels. If set to False, will exclude all channels that are not labeled with type==”fluo” in adata.var.exclude (
Optional[Union`[:py:class:`list[str],str]]) – Channels to be excluded from plotting.stat (
Literal['p','p_adj']) – One of p or p_adj. Specifies whether to show the calculated p value or the adjusted p value.cmap (
Optional[str]) – colormap for the p-value colorbar.test (
Literal['Kruskal','Wilcoxon']) – statistical test that is used for the p-value calculation. One of Kruskal and Wilcoxon. Defaults to Kruskal.min_pval (
Optional[float]) – minimum p_value that is still displayedcomparison_label (
Optional[str]) – Sets the title for the comparisongroup1_label (
Optional[str]) – Sets the labeling for the first groupgroup2_label (
Optional[str]) – Sets the labeling for the second groupfigsize (
tuple[float,float]) – Contains the dimensions of the final figure as a tuple of two ints or floats.return_dataframe (
bool) – If set to True, returns the raw data that are used for plotting as a dataframe.return_fig (
bool) – If set to True, the figure is returned.ax (
Optional[Axes]) – AAxescreated from matplotlib to plot into.show (
bool) – Whether to show the figure. Defaults to True.save (
Optional[str]) – Expects a file path including the file name. Saves the figure to the indicated path. Defaults to None.
- Return type:
Optional[Figure,Axes,DataFrame]]- Returns:
If show==False a
AxesIf return_fig==True a
FigureIf return_dataframe==True a
DataFramecontaining the data used for plotting
Examples
import FACSPy as fp

dataset = fp.mouse_lineages()

fp.tl.mfi(dataset)

fp.pl.fold_change(
    dataset,
    gate = "B_cells",
    groupby = "organ",
    group1 = "BM",
    group2 = "PB",
    figsize = (3,5)
)